Showing posts with label xy line. Show all posts

Thursday, May 2, 2013

RG#102: Double Y axis trellis plot (weather data example)


require(latticeExtra)
require (lattice)

data(SeatacWeather)
tempatures <- xyplot(min.temp + max.temp ~ day | month,
               data = SeatacWeather, type = "l", layout = c(3, 1))
rainfall <- xyplot(precip ~ day | month, data = SeatacWeather, type = "h", lwd = 4)

doubleYScale(tempatures, rainfall, style1 = 0, style2 = 3, add.ylab2 = TRUE,
   text = c("min. T", "max. T", "rain"), columns = 3)


Tuesday, April 30, 2013

RG#96: Basic point and line graph with error bars (publication purpose)


myd <- data.frame (X = c(1:12,1:12),
                   Y = c(8, 12, 13, 18,  22, 16, 24, 29,  34, 15, 8, 6,
                         9, 10, 12, 18, 26, 28, 28, 30, 20, 10, 9, 9),
                   group = rep (c("A-group", "B-group"), each = 12),
                   error = rep (c(2.5, 3.0), each = 12))
                   
require(ggplot2)
require(grid)
# line and point plot
f1 = ggplot(data = myd, aes(x = X, y = Y, group = group) )  # lesion becomes a classifying factor
f2 <- f1 + geom_errorbar(aes(ymin = Y - error, ymax = Y + error), width=0.3) +
geom_line() + geom_point(aes(shape=group, fill=group), size=5)

 f3 <- f2 +  scale_x_continuous("X (units)", breaks=1:12) +
     scale_y_continuous("Y (units)", limits = c(0, 40), breaks=seq(0, 40, by = 5)) +
     scale_shape_manual(values=c(24,21)) +
     scale_fill_manual(values=c("white","black")) +
     stat_abline(intercept=0, slope=0, linetype="dotted") +
     annotate("text", x=11, y=10, label="X") +
     theme_bw()

   optns <- theme (
          plot.title = element_text(face="bold", size=14),
          axis.title.x = element_text(face="bold", size=12),
          axis.title.y = element_text(face="bold", size=12, angle=90),
          panel.grid.major = element_blank(),
          panel.grid.minor = element_blank(),
          legend.position = c(0.2,0.8),
          legend.title = element_blank(),
          legend.text = element_text(size=12),
          legend.key.size = unit(1.5, "lines"),
          legend.key = element_blank()
     )
f3 +  ggtitle ( "MY awsome plot for publication") + optns


Thursday, April 18, 2013

RG#83: Multi-faceted (Trellis) plot of time series plot (weather data example)


st <- as.Date("2009-1-1")
en <- as.Date("2011-12-28")
date1 <- seq(st, en, "1 day")
avgtm <- round (rnorm (length(date1), 50,5), 1)
maxtm <- round (avgtm + 8 + abs(rnorm (length (avgtm), 0, 1)),1)
mintm <-  round (avgtm - 8 + abs(rnorm (length (avgtm), 0, 1)), 1)
myd <- data.frame(date1, maxtm, mintm, avgtm)

# extract month
month <- function(x)format(x, '%m')
year <- function(x)format(x, '%Y')

require(lattice)
require(latticeExtra)

xyplot(avgtm ~ date1 | year(date1), data=myd,
       type='l', layout=c(1, 3),
       scales=list(x=list(relation='free')),
       xlab='', ylab='',
       panel=function(x, y, ...){
           panel.xblocks(x, month,
                         col = c("lightblue", "lightgreen"),
                         border = "darkgray")
           panel.xyplot(x, y, lwd = 1, col='red', ...)
           })


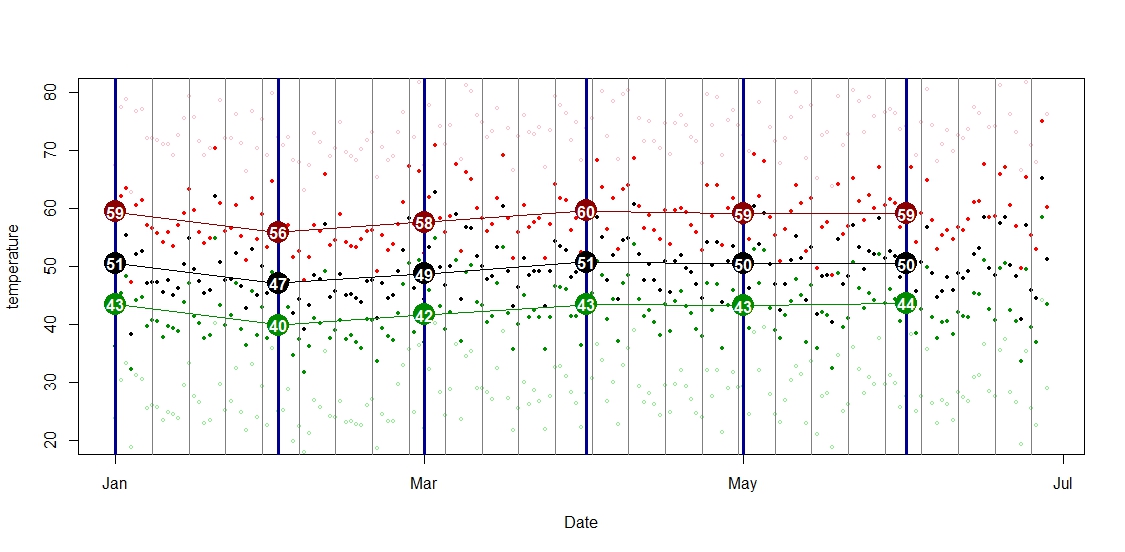
RG#82: Time series plot (weather data with monthly averages connected)


# data 
st <- as.Date ("2009-1-1")
en <- as.Date ("2009-6-28")
date1 <- seq(st, en, "1 day")
year <- format(date1, "%Y")
month <- format (date1, "%b")
day <- as.numeric (format(date1, "%d"))

set.seed(1234)

# average temperature 
avgtm <- round (rnorm (length(date1), 50,5), 1)
# maximum temperature 
maxtm <- round (avgtm + 8 + abs(rnorm (length (avgtm), 0, 1)),1)
# minimum temperature 
mintm <-  round (avgtm - 8 + abs(rnorm (length (avgtm), 0, 1)), 1)
# record maximum temperature 
rmaxtm <- round (maxtm + 15 + abs(rnorm (length (avgtm), 0, 1)), 1)
# record minimum temperature 
rmintm <-  round (mintm - 15 + abs(rnorm (length (avgtm), 0, 1)), 1)
myd <- data.frame ( year, month, day, avgtm, maxtm, mintm, rmaxtm, rmintm )
myd$date <- as.Date(paste(myd$year, myd$month, myd$day), format='%Y %b %d')
levels (myd$month) <- c("Jan", "Feb", "Mar", "Apr", "May", "Jun", "Jul", "Aug","Sep", "Oct", "Nov", "Dec")

# find the position to plot for week points or lines 
# for weeks lines
tw = as.numeric (as.Date (seq(st, en, "weeks")), origin = "1970-1-1")
# find the position to plot for month points or lines 
# for month lines
tm = as.numeric (as.Date (seq(st, en, "months")), origin = "1970-1-1")


# plot
  plot(myd$date, myd$avgtm, type = "p", col = "black", xlab = "Date", ylab = "temperature", pch = 19, ylim = c(20, 80), cex = 0.5)

points(myd$date, myd$maxtm, type = "p", col = "red", xlab = "Date", ylab = "temperature", pch = 19, cex = 0.5)
  points(myd$date, myd$mintm, type = "p", col = "green4", xlab = "Date", ylab = "temperature", pch = 19, cex = 0.5)
  points(myd$date, myd$rmintm, type = "p", col = "lightgreen", xlab = "Date", ylab = "temperature", pch = 1, cex = 0.5)
  points(myd$date, myd$rmaxtm, type = "p", col = "pink", xlab = "Date", ylab = "temperature", pch = 1, cex = 0.5)

abline(v = tw, lty = 1, col = "gray50", lwd = 1)
abline(v = tm, lty = 1, col = "blue4", lwd=3)


 # calculating average mean
out1 <- data.frame (with (myd,  tapply(avgtm, month, mean)))
names(out1) <- c("meanavgtm")
out1$grp <- rownames (out1)
out1$tm <- tm

# ploting mean connected with lines
points (out1$tm, out1$meanavgtm, type = "b", col = "black", pch = 19, cex = 3)
text (out1$tm, out1$meanavgtm, labels = round (out1$meanavgtm, 0), col = "white", font = 2)

 # calculating mean maximum
out2 <- data.frame (with (myd,  tapply(maxtm, month, mean)))
names(out2) <- c("meanavgtm")
out2$grp <- rownames (out2)
out2$tm <- tm

# ploting mean connected with lines
points (out2$tm, out2$meanavgtm, type = "b", col = "red4", pch = 19, cex = 3)
text (out2$tm, out2$meanavgtm, labels = round (out2$meanavgtm, 0), col = "white", font = 2)

 # calculating mean minimum
out3 <- data.frame (with (myd,  tapply(mintm, month, mean)))
names(out3) <- c("meanavgtm")
out3$grp <- rownames (out3)
out3$tm <- tm

# ploting mean connected with lines
points (out3$tm, out3$meanavgtm, type = "b", col = "green4", pch = 19, cex = 3)
text (out3$tm, out3$meanavgtm, labels = round (out3$meanavgtm, 0), col = "white", font = 2)


RG#81: plotting scatter plot with means and samples (means are connected with line while all samples as scatter plot)

set.seed(1234)
Xv <- data.frame (group = rep(1:10, each = 500),
Y = c(rnorm (500, 20, 5), rnorm (500, 35, 10), rnorm (500, 45, 15),
rnorm (500, 65, 18), rnorm (500, 50,15), rnorm( 500, 30, 10),
rnorm (500, 20, 10), rnorm (500, 20, 10),
rnorm (500, 15, 5), rnorm (500, 10,5)))

 # point plot with transparency in color
 with (Xv, plot(group, Y, pch = "-", cex=1.5, col = rgb(red=0, green=0.5, blue=0.5, alpha=0.25)))

 # calculating mean
out1 <- data.frame (with (Xv,  tapply( Y, factor(group), mean)))
names(out1) <- c("meanY")
out1$grp <- rownames (out1)

# ploting mean connected with lines
points (out1$grp, out1$meanY, type = "b", col = "red", pch = 19)


# Hexbin plot may be useful in situation of large number of data points
set.seed(1234)
Xv <- data.frame (group = rep(1:10, each = 5000),
Y = round (c(rnorm (5000, 20, 5), rnorm (5000, 35, 10), rnorm (5000, 45, 15),
rnorm (5000, 65, 18), rnorm (5000, 50,15), rnorm( 5000, 30, 10),
rnorm (5000, 20, 10), rnorm (5000, 20, 10),
rnorm (5000, 15, 5), rnorm (5000, 10,5)), 0))


   require(ggplot2)
require(hexbin)
plt <- ggplot(Xv,aes(x=group,y=Y)) + stat_binhex() + scale_fill_gradientn(colours=c("yellow","red"),name = "Frequency",na.value=NA) + theme_bw()

 # calculating mean
out1 <- data.frame (with (Xv,  tapply( Y, factor(group), mean)))
names(out1) <- c("meanY")
out1$grp <- as.numeric (rownames (out1))

# ploting mean connected with lines
plt1 <- plt + geom_point (aes(grp, meanY), data = out1, pch = 19, col = "blue", cex = 3)


# connecting with line 
plt1 +  geom_line (aes(grp, meanY), data = out1, col = "green1", lwd = 1)


Wednesday, April 17, 2013

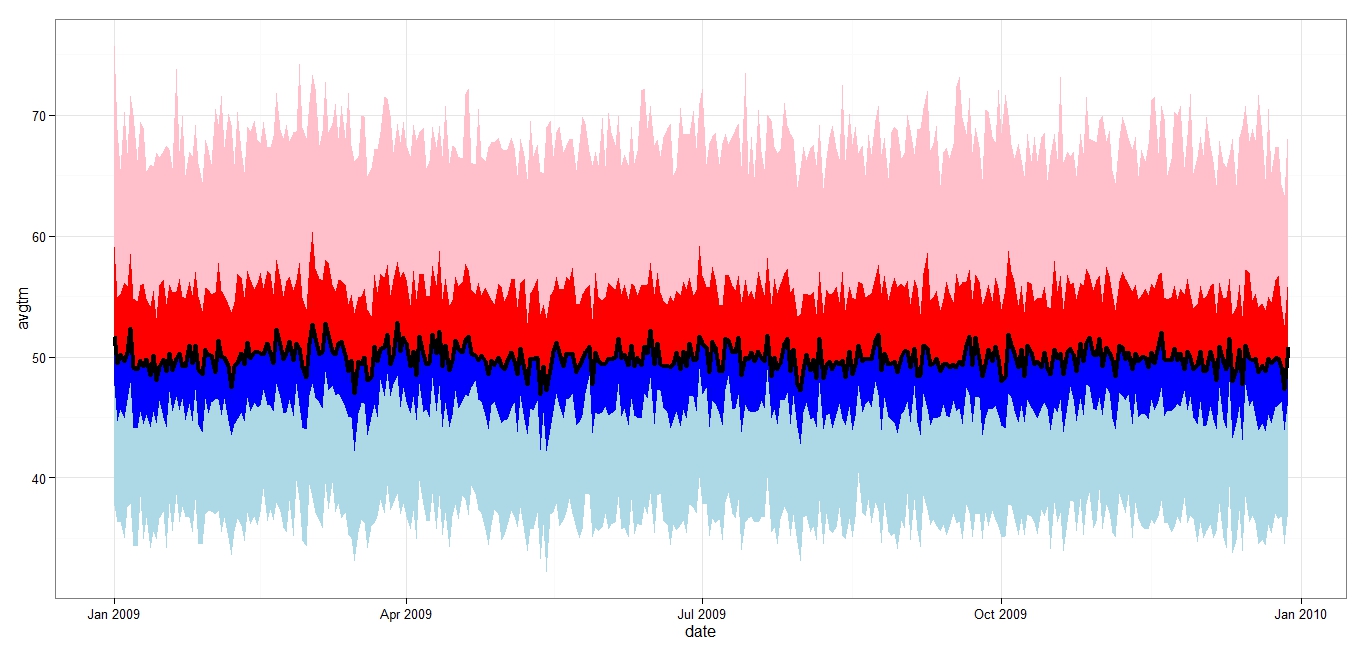
RG#78: Time series area plot (with temperature data as example)


st <- as.Date ("2009-1-1")
en <- as.Date ("2009-12-28")
date1 <- seq(st, en, "1 day")
year <- format(date1, "%Y")
month <- format (date1, "%b")
day <- as.numeric (format(date1, "%d"))

# average daily temperature avgtm <- round (rnorm (length(date1), 50,1), 1)

# maximum daily temperature 
maxtm <- round (avgtm + 5 + abs(rnorm (length (avgtm), 0, 1)),2)

# minimum daily temperature 
mintm <-  round (avgtm - 5 + abs(rnorm (length (avgtm), 0, 1)), 2)

# record maximum daily temperature 
rmaxtm <- round (maxtm + 10 + abs(rnorm (length (avgtm), 0, 3)), 2)

# record minimum daily temperature 
rmintm <-  round (mintm - 10 +  abs(rnorm (length (avgtm), 0, 1)), 3)


myd <- data.frame ( year, month, day, avgtm, maxtm, mintm, rmaxtm, rmintm )
myd$date <- as.Date(paste(myd$year, myd$month, myd$day), format='%Y %b %d')

# for weeks lines 
tw = as.numeric (as.Date (seq(st, en, "weeks")), origin = "1970-1-1")
tw <- data.frame (tw=tw)# for month lines 
tm = as.numeric (as.Date (seq(st, en, "months")), origin = "1970-1-1")
tm <- data.frame (tm=tm)


# plot
require(ggplot2)  # need to install ggplot2 
plt <- ggplot(myd, aes(x= date))
plt1 <- plt + geom_ribbon(aes(ymin= rmintm,  ymax= mintm), fill ="lightblue"geom_ribbon(aes(ymin= mintm,  ymax= avgtm),fill="blue") + 
geom_ribbon(aes(ymin= avgtm,  ymax= maxtm),fill="red") +
geom_ribbon(aes(ymin= maxtm,  ymax= rmaxtm),fill="pink") +  geom_line(aes(y=avgtm), col = "black", lwd = 1.5) + theme_bw()
print (plt1) 


# adding vertical lines at week and month interval 
 plt1 +  geom_vline(data = tm, aes(xintercept = tm), lwd = 1.5, col = "yellow") + geom_vline(data = tw, aes(xintercept = tw), lwd = 0.5, col = "black")


# multiple years 

st <- as.Date ("2009-1-1")
en <- as.Date ("2011-6-28")
date1 <- seq(st, en, "1 day")
year <- format(date1, "%Y")
month <- format (date1, "%b")
day <- as.numeric (format(date1, "%d"))

avgtm <- round (rnorm (length(date1), 50,1), 1)
maxtm <- round (avgtm + 5 + abs(rnorm (length (avgtm), 0, 1)),2)
mintm <-  round (avgtm - 5 + abs(rnorm (length (avgtm), 0, 1)), 2)
rmaxtm <- round (maxtm + 10 + abs(rnorm (length (avgtm), 0, 3)), 2)
rmintm <-  round (mintm - 10 +  abs(rnorm (length (avgtm), 0, 1)), 3)


myd <- data.frame ( year, month, day, avgtm, maxtm, mintm, rmaxtm, rmintm )
myd$date <- as.Date(paste(myd$year, myd$month, myd$day), format='%Y %b %d')

# for weeks lines 
ty = as.numeric (as.Date (seq(st, en, "year")), origin = "1970-1-1")
ty <- data.frame (ty=ty)# for month lines 
tm = as.numeric (as.Date (seq(st, en, "months")), origin = "1970-1-1")
tm <- data.frame (tm=tm)


# plot
require(ggplot2)  # need to install ggplot2 
plt <- ggplot(myd, aes(x= date))
plt1 <- plt + geom_ribbon(aes(ymin= rmintm,  ymax= mintm), fill ="lightblue"geom_ribbon(aes(ymin= mintm,  ymax= avgtm),fill="blue") + 
geom_ribbon(aes(ymin= avgtm,  ymax= maxtm),fill="red") +
geom_ribbon(aes(ymin= maxtm,  ymax= rmaxtm),fill="pink") +  geom_line(aes(y=avgtm), col = "black", lwd = 1.5) + theme_bw()
print (plt1) 


# adding vertical lines at month and year interval 
 plt1 +  geom_vline(data = ty, aes(xintercept = ty), lwd = 1.5, col = "yellow") + geom_vline(data = tm, aes(xintercept = tm), lwd = 0.5, col = "black")


RG#74: Time series plots (weather data example)


st <- as.Date ("2009-1-1")
en <- as.Date ("2009-12-28")
date1 <- seq(st, en, "1 day")
year <- format(date1, "%Y")
month <- format (date1, "%b")
day <- as.numeric (format(date1, "%d"))

avgtm <- round (rnorm (length(date1), 50,5), 1)
maxtm <- round (avgtm + abs(rnorm (length (avgtm), 0, 5)),1)
mintm <-  round (avgtm - abs(rnorm (length (avgtm), 0, 5)), 1)
rmaxtm <- round (maxtm + abs(rnorm (length (avgtm), 0, 5)), 1)
rmintm <-  round (mintm - abs(rnorm (length (avgtm), 0, 5)), 1)


myd <- data.frame ( year, month, day, avgtm, maxtm, mintm, rmaxtm, rmintm )
myd$date <- as.Date(paste(myd$year, myd$month, myd$day), format='%Y %b %d')

# for weeks lines 
tw = as.numeric (as.Date (seq(st, en, "weeks")), origin = "1970-1-1")

# for month lines 
tm = as.numeric (as.Date (seq(st, en, "months")), origin = "1970-1-1")

# plot

   plot(myd$date, myd$avgtm, type = "l", col = "red", xlab = "Date", ylab = "temperature")
   points(myd$date, myd$maxtm, type = "p", col = "green", xlab = "Date", ylab = "temperature", pch = "+", cex = 0.5)
  points(myd$date, myd$mintm, type = "p", col = "blue", xlab = "Date", ylab = "temperature", pch = "-", cex = 0.75)


  abline(v = tw, lty = 1, col = "gray50", lwd = 1)
   abline(v = tm, lty = 1, col = "blue4", lwd=3)

# plot multiple year single plot

st <- as.Date ("2009-1-1")
en <- as.Date ("2012-12-28")
date1 <- seq(st, en, "7 day")
year <- format(date1, "%Y")
month <- format (date1, "%b")
day <- as.numeric (format(date1, "%d"))

avgtm <- round (rnorm (length(date1), 50,5), 1)
maxtm <- round (avgtm + abs(rnorm (length (avgtm), 0, 5)),1)
mintm <-  round (avgtm - abs(rnorm (length (avgtm), 0, 5)), 1)
rmaxtm <- round (maxtm + abs(rnorm (length (avgtm), 0, 5)), 1)
rmintm <-  round (mintm - abs(rnorm (length (avgtm), 0, 5)), 1)


myd <- data.frame ( year, month, day, avgtm, maxtm, mintm, rmaxtm, rmintm )
myd$date <- as.Date(paste(myd$year, myd$month, myd$day), format='%Y %b %d')

# for weeks lines 
ty = as.numeric (as.Date (seq(st, en, "years")), origin = "1970-1-1")

# for month lines 
tm = as.numeric (as.Date (seq(st, en, "months")), origin = "1970-1-1")

# plot

   plot(myd$date, myd$avgtm, type = "l", col = "red", xlab = "Date", ylab = "temperature")
   points(myd$date, myd$maxtm, type = "p", col = "green", xlab = "Date", ylab = "temperature", pch = "+", cex = 0.5)
  points(myd$date, myd$mintm, type = "p", col = "blue", xlab = "Date", ylab = "temperature", pch = "-", cex = 0.75)

abline(v = tm, lty = 1, col = "gray70", lwd=1)


 abline(v = ty, lty = 1, col = "blue", lwd=4)


Monday, April 8, 2013

RG#37: XY line or scatter plot graph with two Y axis

# data
set.seed(1234)
x <- 1:20
y1 <- rnorm(20, 5, 1)
y2 <- rnorm(20,20, 2)

y3 <- rnorm(20,5, 3)


# plot
par(mar=c(5,4,4,5)+.1)
plot(x,y1,type="l",col="red", ylab = "Y1/Y3")

points (x,y3, col = "green4", pch = 19)

par(new=TRUE)
plot(x, y2, type="l",col="blue",xaxt="n",yaxt="n",xlab="",ylab="")

axis(4)
mtext("y2",side=4,line=3)


Friday, April 5, 2013

RG#8: polar plot

# data
varnames <- letters[1:20]
set.seed (56445)
corr <- rnorm(20, 0, 0.5)

#plot using the package plotrix
require(plotrix)

 par(mfrow=c(3,1)) # for graph arrangement

polar.plot(corr, polar.pos=NULL, labels = varnames, main="Polar Plot",lwd=3,line.col=4)

# different style variations
# typle s
polar.plot(corr, polar.pos=NULL, labels = varnames, main="Polar Plot, type s", rp.type="s")

# type p
polar.plot(corr, polar.pos=NULL, labels = varnames, main="Polar Plot, type p",lwd=3,line.col=4, rp.type="p")


RG #4: basic XY plot with regression line (with diffrent plotting parameters) in R

# data
length <- c(10.2, 35, 16.3, 8.9, 14.2, 20.1, 4.3)
width <- c(3.2, 1.5, 2.3, 4.9, 16.2, 3.1, 5.3)


# simple scatter plot
plot(length, width)

# adding regression line
 abline(lm(width ~ length))
# add title
title("Regression of length on width")


# with different parameters, see ?par to see what they mean
  plot(length, width, type ="b" , lty = 2, main = " main title", sub = " sub title", xlab = " x variable (units) ", ylab = " y variable units ", bg = "white", bty= "7", cex= 2, cex.axis = 1,
cex.lab = 1, cex.main = 2, cex.sub = 1, col = "red", col.axis = "black", col.lab = "black",
col.main = "blue", col.sub = "black", family = "sans", fg = "black", font = 3, font.axis = 3,
font.main = 2, font.sub =1, pch = 19, tck = 1 )


# adding grid lines
 grid(nx = 40, ny = 40, col = "lightgray", lty = "dotted", lwd = par("lwd"), equilogs = TRUE)


# adding regression line
abline(lm(width ~ length))

# changing box:
box(lty = '1373', col = 'blue')