Showing posts with label points. Show all posts

Tuesday, April 9, 2013

RG#46: 3D-spinning scatter plots


set.seed(12444)
X = rnorm (1000, 50, 10)
Y = X*0.6+rnorm(length(X), 0, 10)
Z = Y*0.3+ +rnorm(length(X), 0, 10) 


# using rgl package 

library(rgl)

plot3d(Z, X, Y, col="red", size=3)


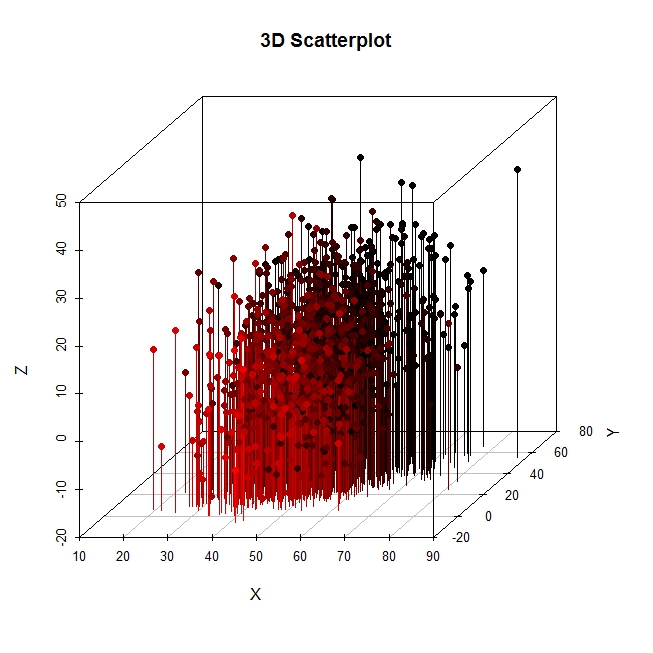
# another using package Rcmdr 

library(Rcmdr)
scatter3d(Z, X, Y)


RG#45: 3D scatter plots (with vertical lines and regression line)


set.seed(12444)
X = rnorm (1000, 50, 10)
Y = X*0.6+rnorm(length(X), 0, 10)
Z = Y*0.3+ +rnorm(length(X), 0, 10) 


# 3D Scatterplot
require(scatterplot3d)
scatterplot3d(X,Y,Z, pch = 19, color = "green4", main="3D Scatterplot")


thdp <- scatterplot3d(X,Y,Z, pch = 19,  main="3D Scatterplot", highlight.3d=TRUE,
type="h")

fitm <- lm(Z ~ X+Y) 
thdp$plane3d(fitm)

trdt <- scatterplot3d(X,Y,Z, pch = 19, color = "green4", main="3D Scatterplot")
trdt$plane3d(fitm)


require(lattice)

cloud(Z~X*Y,main="3D Scatterplot", pch = 18, col = "green4", scales = list(arrows = FALSE))