Showing posts with label kernel density. Show all posts

Monday, April 8, 2013

RG#35: density or Kernel density plot

# data
set.seed(1234)
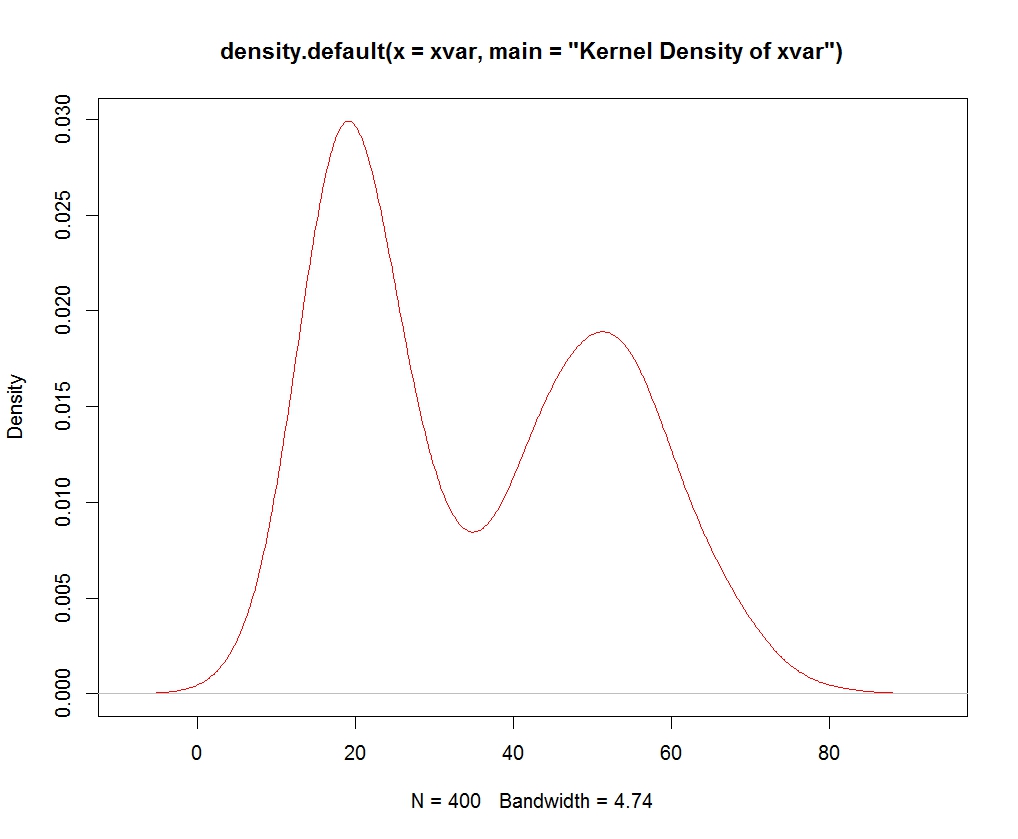
xvar <-  c(rnorm (200, 20, 5), rnorm (200, 50, 10))

# Kernel Density Plot
dnt <- density(xvar, main="Kernel Density of xvar")
plot(dnt, col = "red")


# density area plot
polygon(dnt, col="cyan4", border="red")


Sunday, April 7, 2013

RG#21: Plotting curves (any formula, normal density )

#Example:
 curve(x^2, col = "red")

curve(x^3-x+1.5,from=-10,to=10,lty=2, col = "blue")
 # normal curve
x=seq(-50,150,length=1000)
set.seed(1234)
y=dnorm(x,mean=50,sd=30)
plot(x,y,type="l",lwd=2,col="red")

# add one or more curves
curve(x^2-1, col = "green2")
curve(x^2-5*x, -2.5, 2.5, add = TRUE, col = "red")

 
# add curves to scatter plot
# xyscatter plot
set.seed(1234)
x = c(0.1, 0.2, 0.3, 0.4, 0.5)
y = (-0.5*log (1-(2*x)) + rnorm(length (x), 0.2, 0.1))
plot(x,y, col = "red",  pch = 18)
 
curve(-0.5*log (1-(2*x)),from=0,to=0.5, lty=2,   col = "blue", add = TRUE)


Friday, April 5, 2013

RG#11:multiple histograms with normal distribution or density curve overlayed

#data
set.seed(1233)

data1 < - data.frame(pop =c(rep("A x B", 200), rep("A x C", 200), rep("B x C", 200) ) , var1 = c(rnorm(1000, 90,10), rnorm(1000, 50, 10), rnorm(1000, 20, 30)))

#plot
require(lattice)


# plot overall distribution
histogram(~ var1, data= data1, nint = 12, xlab = "trait1(measuring unit)", type = "density", panel = function(x, ...) {
panel.histogram(x, ...)
panel.mathdensity(dmath = dnorm, col = "black",
args = list(mean=mean(x),sd=sd(x)))
} )


# plot by each group
histogram(~ var1|factor(pop), data= data1, nint = 10, xlab = "trait1(measuring unit)", type = "density",
panel = function(x, ...) {
panel.histogram(x, col = "darkgreen", ...)
panel.mathdensity(dmath = dnorm, col = "red",
args = list(mean=mean(x),sd=sd(x)))
} )


RG#9: Drawing basic normal curve

# data
# generate 600 numbers in sequence between -4 to 4
x <- seq(-4, 4, length=600)
# calculate normal density
ds <- dnorm(x)


# plot
plot(x, ds, type="l", lty=1, col = 2, xlab="x value", ylab="Density", main="standarized normal distribution curve")