
# data
st <- as.Date ("2009-1-1")
en <- as.Date ("2009-6-28")
date1 <- seq(st, en, "1 day")
year <- format(date1, "%Y")
month <- format (date1, "%b")
day <- as.numeric (format(date1, "%d"))
set.seed(1234)
# average temperature
avgtm <- round (rnorm (length(date1), 50,5), 1)
# maximum temperature
maxtm <- round (avgtm + 8 + abs(rnorm (length (avgtm), 0, 1)),1)
# minimum temperature
mintm <- round (avgtm - 8 + abs(rnorm (length (avgtm), 0, 1)), 1)
# record maximum temperature
rmaxtm <- round (maxtm + 15 + abs(rnorm (length (avgtm), 0, 1)), 1)
# record minimum temperature
rmintm <- round (mintm - 15 + abs(rnorm (length (avgtm), 0, 1)), 1)
myd <- data.frame ( year, month, day, avgtm, maxtm, mintm, rmaxtm, rmintm )
myd$date <- as.Date(paste(myd$year, myd$month, myd$day), format='%Y %b %d')
levels (myd$month) <- c("Jan", "Feb", "Mar", "Apr", "May", "Jun", "Jul", "Aug","Sep", "Oct", "Nov", "Dec")
# find the position to plot for week points or lines
# for weeks lines
tw = as.numeric (as.Date (seq(st, en, "weeks")), origin = "1970-1-1")
# find the position to plot for month points or lines
# for month lines
tm = as.numeric (as.Date (seq(st, en, "months")), origin = "1970-1-1")
# plot
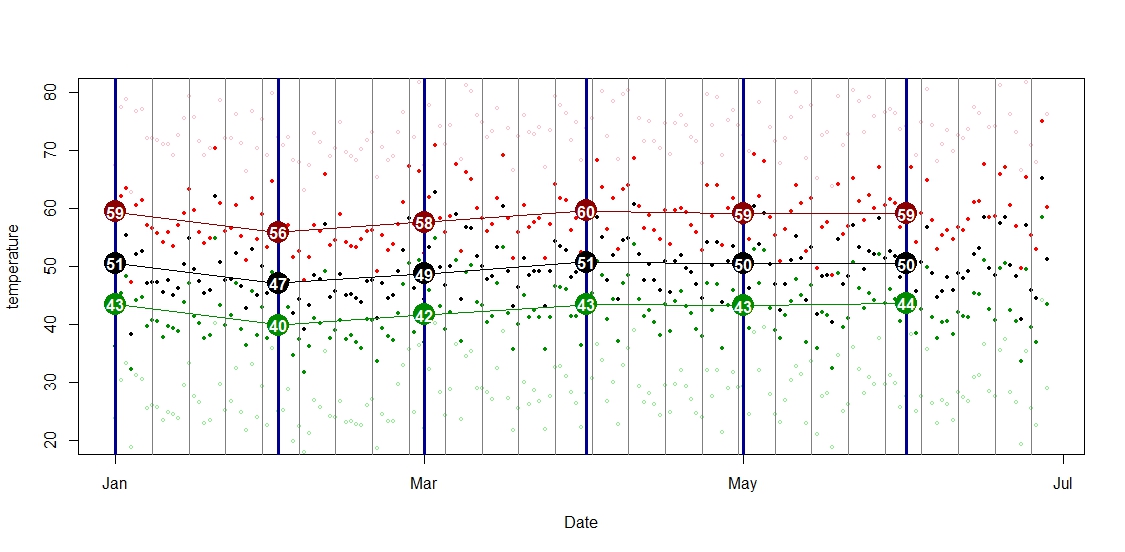
plot(myd$date, myd$avgtm, type = "p", col = "black", xlab = "Date", ylab = "temperature", pch = 19, ylim = c(20, 80), cex = 0.5)
points(myd$date, myd$maxtm, type = "p", col = "red", xlab = "Date", ylab = "temperature", pch = 19, cex = 0.5)
points(myd$date, myd$mintm, type = "p", col = "green4", xlab = "Date", ylab = "temperature", pch = 19, cex = 0.5)
points(myd$date, myd$rmintm, type = "p", col = "lightgreen", xlab = "Date", ylab = "temperature", pch = 1, cex = 0.5)
points(myd$date, myd$rmaxtm, type = "p", col = "pink", xlab = "Date", ylab = "temperature", pch = 1, cex = 0.5)
abline(v = tw, lty = 1, col = "gray50", lwd = 1)
abline(v = tm, lty = 1, col = "blue4", lwd=3)
# calculating average mean
out1 <- data.frame (with (myd, tapply(avgtm, month, mean)))
names(out1) <- c("meanavgtm")
out1$grp <- rownames (out1)
out1$tm <- tm
# ploting mean connected with lines
points (out1$tm, out1$meanavgtm, type = "b", col = "black", pch = 19, cex = 3)
text (out1$tm, out1$meanavgtm, labels = round (out1$meanavgtm, 0), col = "white", font = 2)
# calculating mean maximum
out2 <- data.frame (with (myd, tapply(maxtm, month, mean)))
names(out2) <- c("meanavgtm")
out2$grp <- rownames (out2)
out2$tm <- tm
# ploting mean connected with lines
points (out2$tm, out2$meanavgtm, type = "b", col = "red4", pch = 19, cex = 3)
text (out2$tm, out2$meanavgtm, labels = round (out2$meanavgtm, 0), col = "white", font = 2)
# calculating mean minimum
out3 <- data.frame (with (myd, tapply(mintm, month, mean)))
names(out3) <- c("meanavgtm")
out3$grp <- rownames (out3)
out3$tm <- tm
# ploting mean connected with lines
points (out3$tm, out3$meanavgtm, type = "b", col = "green4", pch = 19, cex = 3)
text (out3$tm, out3$meanavgtm, labels = round (out3$meanavgtm, 0), col = "white", font = 2)
No comments:
Post a Comment
Note: Only a member of this blog may post a comment.