
# data
set.seed(1234)
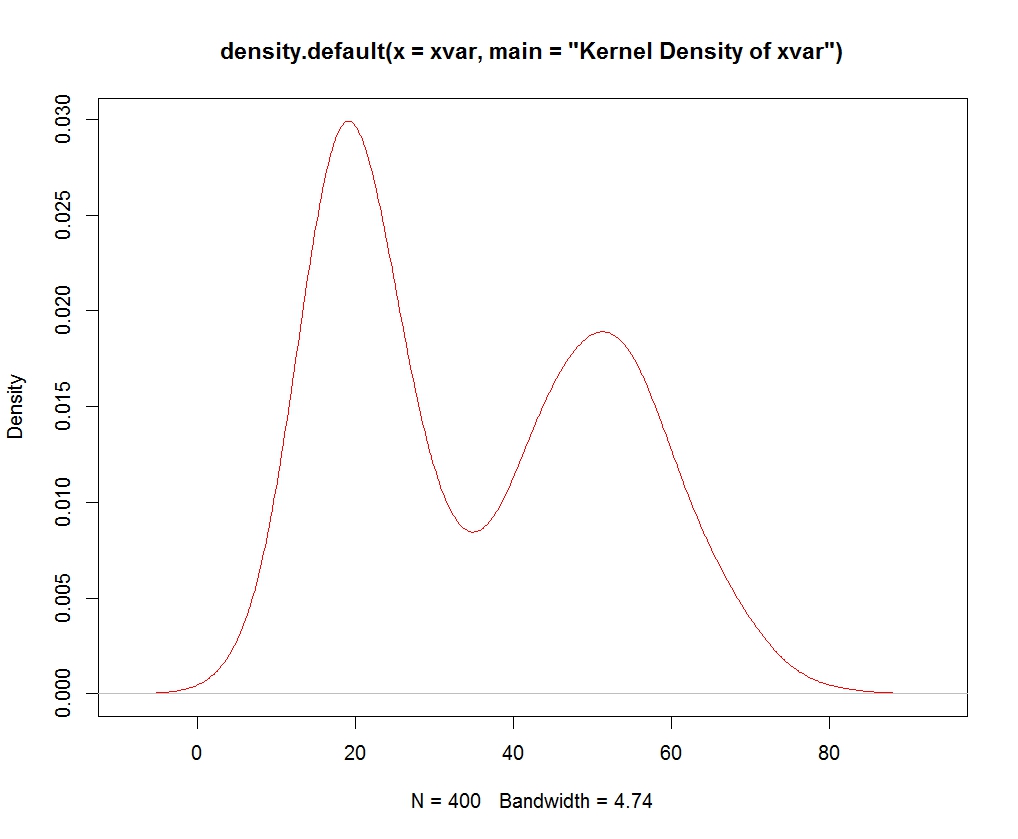
xvar <- c(rnorm (200, 20, 5), rnorm (200, 50, 10))
# Kernel Density Plot
dnt <- density(xvar, main="Kernel Density of xvar")
plot(dnt, col = "red")
# density area plot
polygon(dnt, col="cyan4", border="red")

set.seed(1234)
xvar <- c(rnorm (200, 20, 5), rnorm (200, 50, 10))
# Kernel Density Plot
dnt <- density(xvar, main="Kernel Density of xvar")
plot(dnt, col = "red")
# density area plot
polygon(dnt, col="cyan4", border="red")
No comments:
Post a Comment
Note: Only a member of this blog may post a comment.