
set.seed(9001)
p.value <- vector()
dataf <- as.data.frame(matrix(rep(NA, 2000), nrow=100))
names(dataf) <- c(paste("V",1:19, sep=""), "y")
for(i in 1:20) {
dataf[,i] <- rnorm(20, 50, 10)
}
p.value <- vector()
dataf <- as.data.frame(matrix(rep(NA, 2000), nrow=100))
names(dataf) <- c(paste("V",1:19, sep=""), "y")
for(i in 1:20) {
dataf[,i] <- rnorm(20, 50, 10)
}
#plot
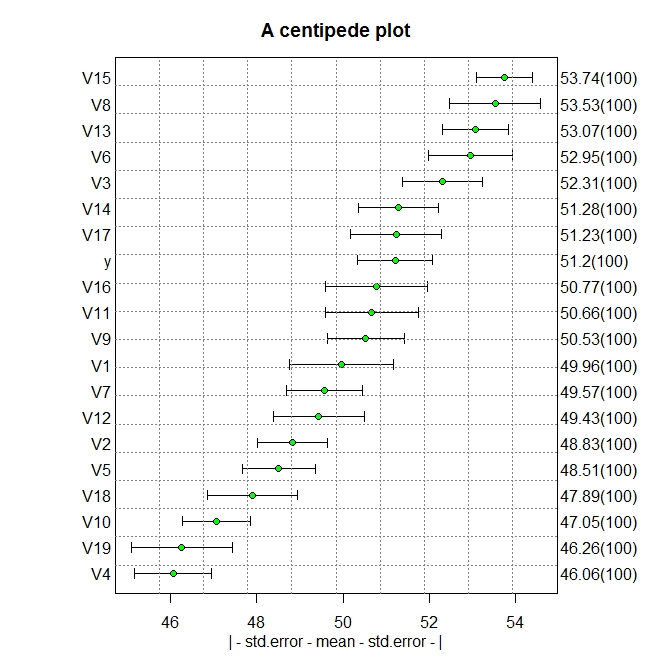
require (plotrix)
seg<-get.segs(dataf)
require (plotrix)
seg<-get.segs(dataf)
centipede.plot(seg, main= "A centipede plot",vgrid=c(10))
#adding grids to the plot
grid(nx = 10, ny = 19, col = "gray50")
grid(nx = 10, ny = 19, col = "gray50")
No comments:
Post a Comment
Note: Only a member of this blog may post a comment.