
require(ggplot2)
# function
ruler.bar.plot <-function(gg, nn, mjtick =1, mntick = 0.2, mjtickcol = "black", mntickcol = "white"){
seq.list<-list()
for(i in 1:length(gg)){
ystart<-seq(mntick ,gg[i],mntick )
yend<-ystart
xstart<-rep(i-0.45,length(ystart))
xend<-xstart+0.1
nam.val<-c(nn[i],rep(NA,length(ystart)-1))
numb.val<-c(gg[i],rep(NA,length(ystart)-1))
seq.list[[i]]<-data.frame(nam.val,numb.val,xstart,xend,ystart,yend)
}
df<-as.data.frame(do.call(rbind, seq.list))
p <- ggplot(df, aes(nam.val))
p + geom_bar(aes(y=numb.val,fill=nam.val),stat="identity",width=0.5,color=mjtickcol,lwd=1.1) +
geom_segment(aes(x=xstart,y=ystart,xend=xend,yend=yend), color=mjtickcol) +
ylim(c(0,max(gg)+0.5)) + scale_x_discrete(limits= nn) +
geom_hline(yintercept=seq(mjtick,max(gg),mjtick),color=mntickcol,lwd=1.1)+ geom_text(aes (y = numb.val, label = numb.val), vjust= - 1 ) +
guides(fill=FALSE) +
theme_bw()+
theme(axis.title=element_blank(),
axis.text.y=element_blank(),
axis.text.x=element_text(angle=90,face="bold",size=rel(1.5)),
axis.ticks=element_blank(),
panel.background = element_rect(fill = mntickcol),
panel.border=element_blank(),
panel.grid=element_blank(),
legend.position = "none")
}
# human height in inches, ticking done at each 12
htinch <- c(66, 72, 88, 54)
id <- c("A", "B", "C", "D")
ruler.bar.plot(htinch, id, mjtick =12, mntick = 1, mjtickcol = "black", mntickcol = "white")
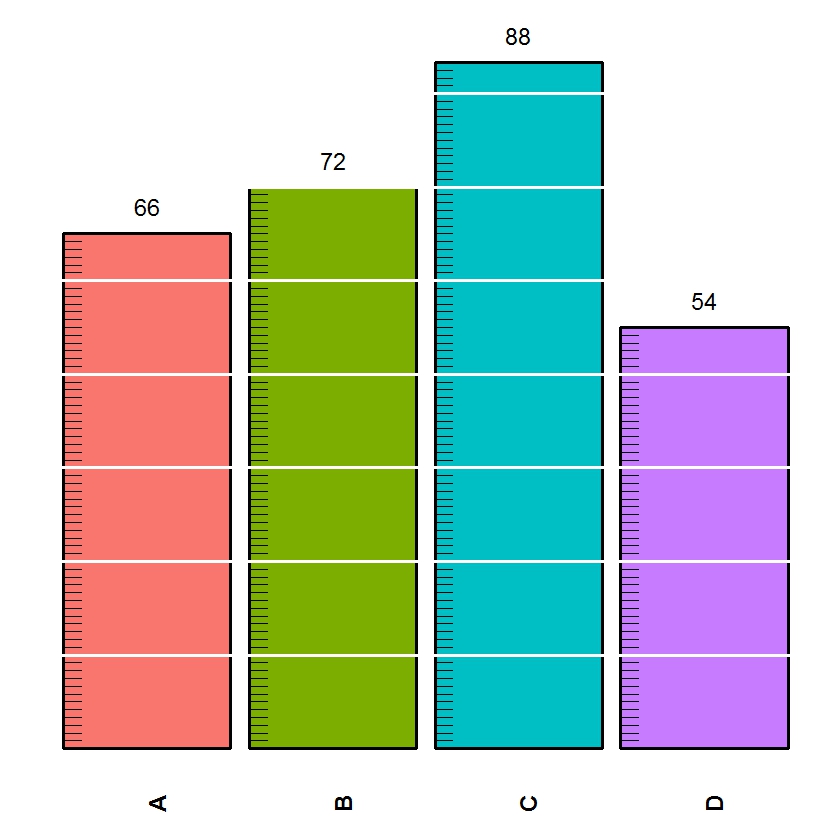
ruler.bar.plot(htinch, id, mjtick =12, mntick = 2, mjtickcol = "red", mntickcol = "lightgoldenrodyellow")

VV = c(0.13, 0.33, 0.82, 0.46)
LV = c("A", "C", "L", "N")
ruler.bar.plot(VV, LV, mjtick =0.1, mntick = 0.02, mjtickcol = "black", mntickcol = "white")

# function
ruler.bar.plot <-function(gg, nn, mjtick =1, mntick = 0.2, mjtickcol = "black", mntickcol = "white"){
seq.list<-list()
for(i in 1:length(gg)){
ystart<-seq(mntick ,gg[i],mntick )
yend<-ystart
xstart<-rep(i-0.45,length(ystart))
xend<-xstart+0.1
nam.val<-c(nn[i],rep(NA,length(ystart)-1))
numb.val<-c(gg[i],rep(NA,length(ystart)-1))
seq.list[[i]]<-data.frame(nam.val,numb.val,xstart,xend,ystart,yend)
}
df<-as.data.frame(do.call(rbind, seq.list))
p <- ggplot(df, aes(nam.val))
p + geom_bar(aes(y=numb.val,fill=nam.val),stat="identity",width=0.5,color=mjtickcol,lwd=1.1) +
geom_segment(aes(x=xstart,y=ystart,xend=xend,yend=yend), color=mjtickcol) +
ylim(c(0,max(gg)+0.5)) + scale_x_discrete(limits= nn) +
geom_hline(yintercept=seq(mjtick,max(gg),mjtick),color=mntickcol,lwd=1.1)+ geom_text(aes (y = numb.val, label = numb.val), vjust= - 1 ) +
guides(fill=FALSE) +
theme_bw()+
theme(axis.title=element_blank(),
axis.text.y=element_blank(),
axis.text.x=element_text(angle=90,face="bold",size=rel(1.5)),
axis.ticks=element_blank(),
panel.background = element_rect(fill = mntickcol),
panel.border=element_blank(),
panel.grid=element_blank(),
legend.position = "none")
}
# human height in inches, ticking done at each 12
htinch <- c(66, 72, 88, 54)
id <- c("A", "B", "C", "D")
ruler.bar.plot(htinch, id, mjtick =12, mntick = 1, mjtickcol = "black", mntickcol = "white")
ruler.bar.plot(htinch, id, mjtick =12, mntick = 2, mjtickcol = "red", mntickcol = "lightgoldenrodyellow")
VV = c(0.13, 0.33, 0.82, 0.46)
LV = c("A", "C", "L", "N")
ruler.bar.plot(VV, LV, mjtick =0.1, mntick = 0.02, mjtickcol = "black", mntickcol = "white")
No comments:
Post a Comment
Note: Only a member of this blog may post a comment.