
st <- as.Date ("2009-1-1")
en <- as.Date ("2009-12-28")
date1 <- seq(st, en, "1 day")
year <- format(date1, "%Y")
month <- format (date1, "%b")
day <- as.numeric (format(date1, "%d"))
# average daily temperature avgtm <- round (rnorm (length(date1), 50,1), 1)
# maximum daily temperature
maxtm <- round (avgtm + 5 + abs(rnorm (length (avgtm), 0, 1)),2)
# minimum daily temperature
mintm <- round (avgtm - 5 + abs(rnorm (length (avgtm), 0, 1)), 2)
# record maximum daily temperature
rmaxtm <- round (maxtm + 10 + abs(rnorm (length (avgtm), 0, 3)), 2)
# record minimum daily temperature
rmintm <- round (mintm - 10 + abs(rnorm (length (avgtm), 0, 1)), 3)
myd <- data.frame ( year, month, day, avgtm, maxtm, mintm, rmaxtm, rmintm )
myd$date <- as.Date(paste(myd$year, myd$month, myd$day), format='%Y %b %d')
# for weeks lines
tw = as.numeric (as.Date (seq(st, en, "weeks")), origin = "1970-1-1")
tw <- data.frame (tw=tw)# for month lines
tm = as.numeric (as.Date (seq(st, en, "months")), origin = "1970-1-1")
tm <- data.frame (tm=tm)
# plot
require(ggplot2) # need to install ggplot2
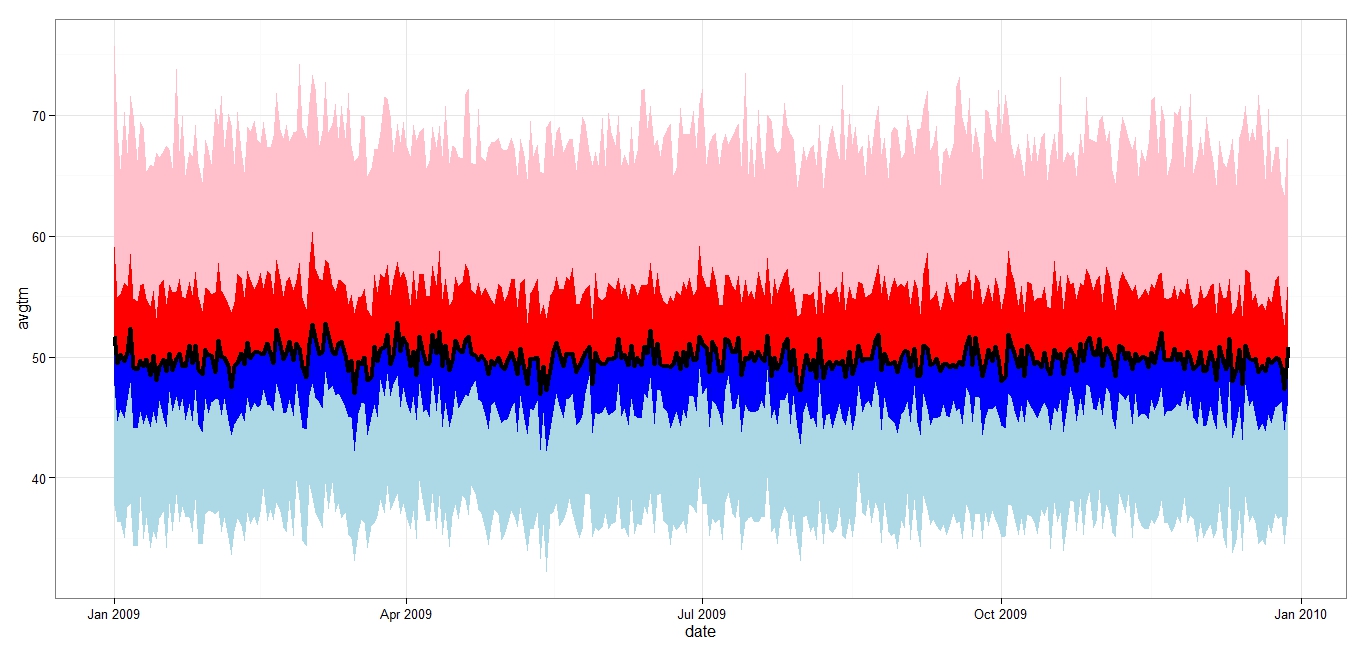
plt <- ggplot(myd, aes(x= date))
plt1 <- plt + geom_ribbon(aes(ymin= rmintm, ymax= mintm), fill ="lightblue") + geom_ribbon(aes(ymin= mintm, ymax= avgtm),fill="blue") +
geom_ribbon(aes(ymin= avgtm, ymax= maxtm),fill="red") +
geom_ribbon(aes(ymin= maxtm, ymax= rmaxtm),fill="pink") + geom_line(aes(y=avgtm), col = "black", lwd = 1.5) + theme_bw()
print (plt1)
# adding vertical lines at week and month interval
plt1 + geom_vline(data = tm, aes(xintercept = tm), lwd = 1.5, col = "yellow") + geom_vline(data = tw, aes(xintercept = tw), lwd = 0.5, col = "black")

# multiple years
st <- as.Date ("2009-1-1")
en <- as.Date ("2011-6-28")
date1 <- seq(st, en, "1 day")
year <- format(date1, "%Y")
month <- format (date1, "%b")
day <- as.numeric (format(date1, "%d"))
avgtm <- round (rnorm (length(date1), 50,1), 1)
maxtm <- round (avgtm + 5 + abs(rnorm (length (avgtm), 0, 1)),2)
mintm <- round (avgtm - 5 + abs(rnorm (length (avgtm), 0, 1)), 2)
rmaxtm <- round (maxtm + 10 + abs(rnorm (length (avgtm), 0, 3)), 2)
rmintm <- round (mintm - 10 + abs(rnorm (length (avgtm), 0, 1)), 3)
myd <- data.frame ( year, month, day, avgtm, maxtm, mintm, rmaxtm, rmintm )
myd$date <- as.Date(paste(myd$year, myd$month, myd$day), format='%Y %b %d')
# for weeks lines
ty = as.numeric (as.Date (seq(st, en, "year")), origin = "1970-1-1")
ty <- data.frame (ty=ty)# for month lines
tm = as.numeric (as.Date (seq(st, en, "months")), origin = "1970-1-1")
tm <- data.frame (tm=tm)
# plot
require(ggplot2) # need to install ggplot2
plt <- ggplot(myd, aes(x= date))
plt1 <- plt + geom_ribbon(aes(ymin= rmintm, ymax= mintm), fill ="lightblue") + geom_ribbon(aes(ymin= mintm, ymax= avgtm),fill="blue") +
geom_ribbon(aes(ymin= avgtm, ymax= maxtm),fill="red") +
geom_ribbon(aes(ymin= maxtm, ymax= rmaxtm),fill="pink") + geom_line(aes(y=avgtm), col = "black", lwd = 1.5) + theme_bw()
print (plt1)

# adding vertical lines at month and year interval
plt1 + geom_vline(data = ty, aes(xintercept = ty), lwd = 1.5, col = "yellow") + geom_vline(data = tm, aes(xintercept = tm), lwd = 0.5, col = "black")

No comments:
Post a Comment
Note: Only a member of this blog may post a comment.